It’s time to talk about feature engineering. Using just the tools of linear regression, we can greatly increase the complexity of our models by creating features from our underlying data. A feature is a new predictor that we create by applying some function to our existing set of predictors. We can think of it as manipulating the data to dig out underlying patterns.
The best example are polynomial features. Suppose we have a single predictor X which is spaced evenly between 0 and 10, and a response Y. Say we plot Y against X and it looks like this
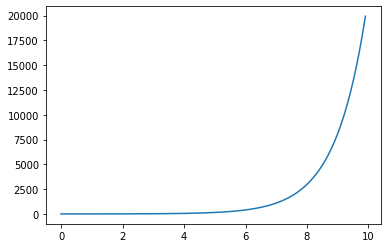
Lets try and do a simple linear regression against Y.
import numpy as np
from sklearn.linear_model import LinearRegression
from matplotlib import pyplot as plt

linear_model = LinearRegression().fit([[x] for x in X],Y)
linear_predictions = linear_model.predict([[x] for x in X])
plt.plot(X,Y)
plt.plot(X, linear_predictions)
plt.show()
This will create something like this
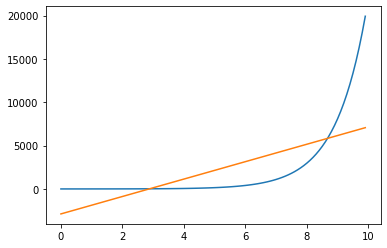
Not very good at all. So, let’s try adding a new feature. We will define this feature as the square of X, like so
square_model = LinearRegression().fit([[x, x**2] for x in X], Y)
square_predictions = square_model.predict([[x, x**2]])
plt.plot(X,Y)
plt.plot(X, square_predictions)
plt.show()
This will give you something that looks a bit better
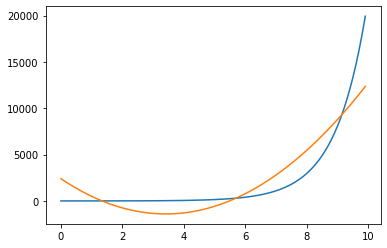
Although our regression is still linear, now we are fitting the closest quadratic rather than the closest straight line. This is also called polynomial regression. But I think it makes more sense to think of it as a form of feature engineering.
Now, let’s add another feature, the cube of X.
cubic_model = LinearRegression().fit([[x, x**2, x**3] for x in X], Y)
cubic_predictions = cubic_model.predict([[x, x**2, x**3]])
plt.plot(X,Y)
plt.plot(X, cubic_predictions)
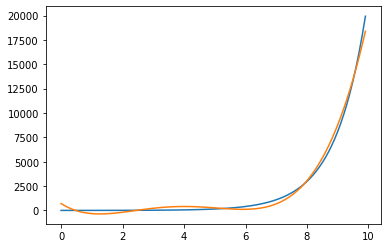
plt.show()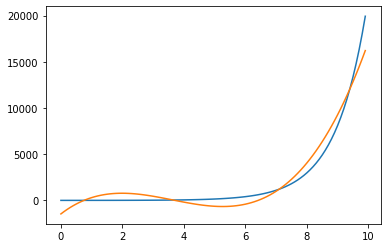
Now we’re getting there. If we add the fourth powers of X as a feature, we will get an even better looking fit
We are not just limited to polynomial features, as we shall see. However we shouldn’t bother with linear features, as any linear term is already captured in the regression itself. When we fit, we already find the best possible linear combination of the predictors . So our features need to be non-linear in our existing predictors. A big part of building and fitting models is finding useful features in our data like this.